“jira-helper” features
Swimlane Chart Bar
Displays the number of tickets in every cell of the row on the swimlane bar hover.
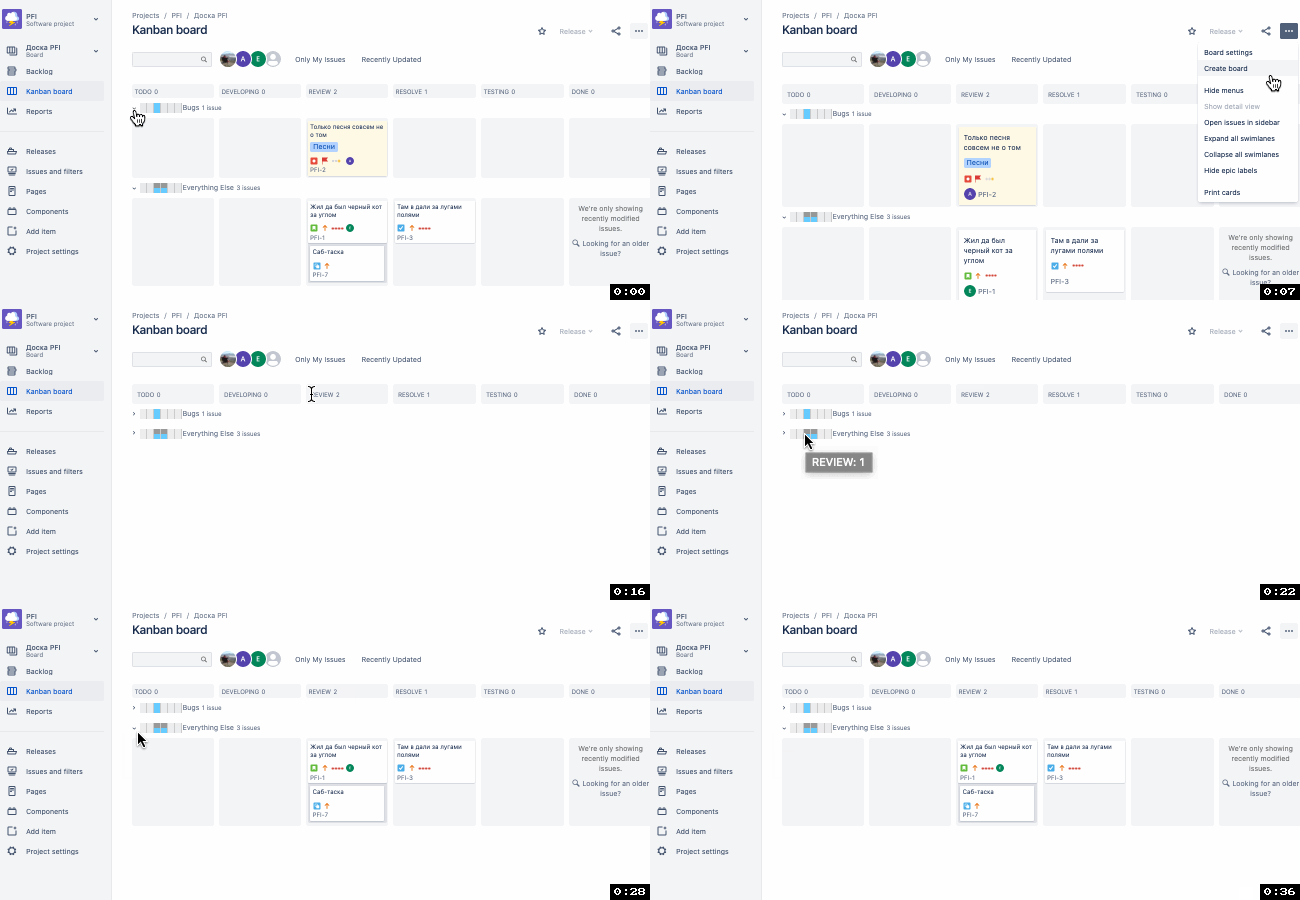
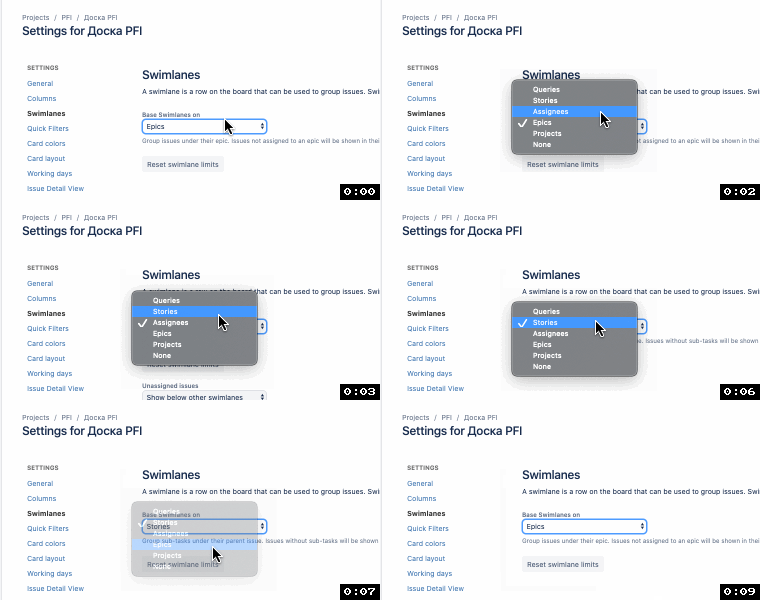
Can be used to overview swimlane state when you have lots of swimlanes, i.e. when you have swimlanes based on Epics, Stories, or Assignees.
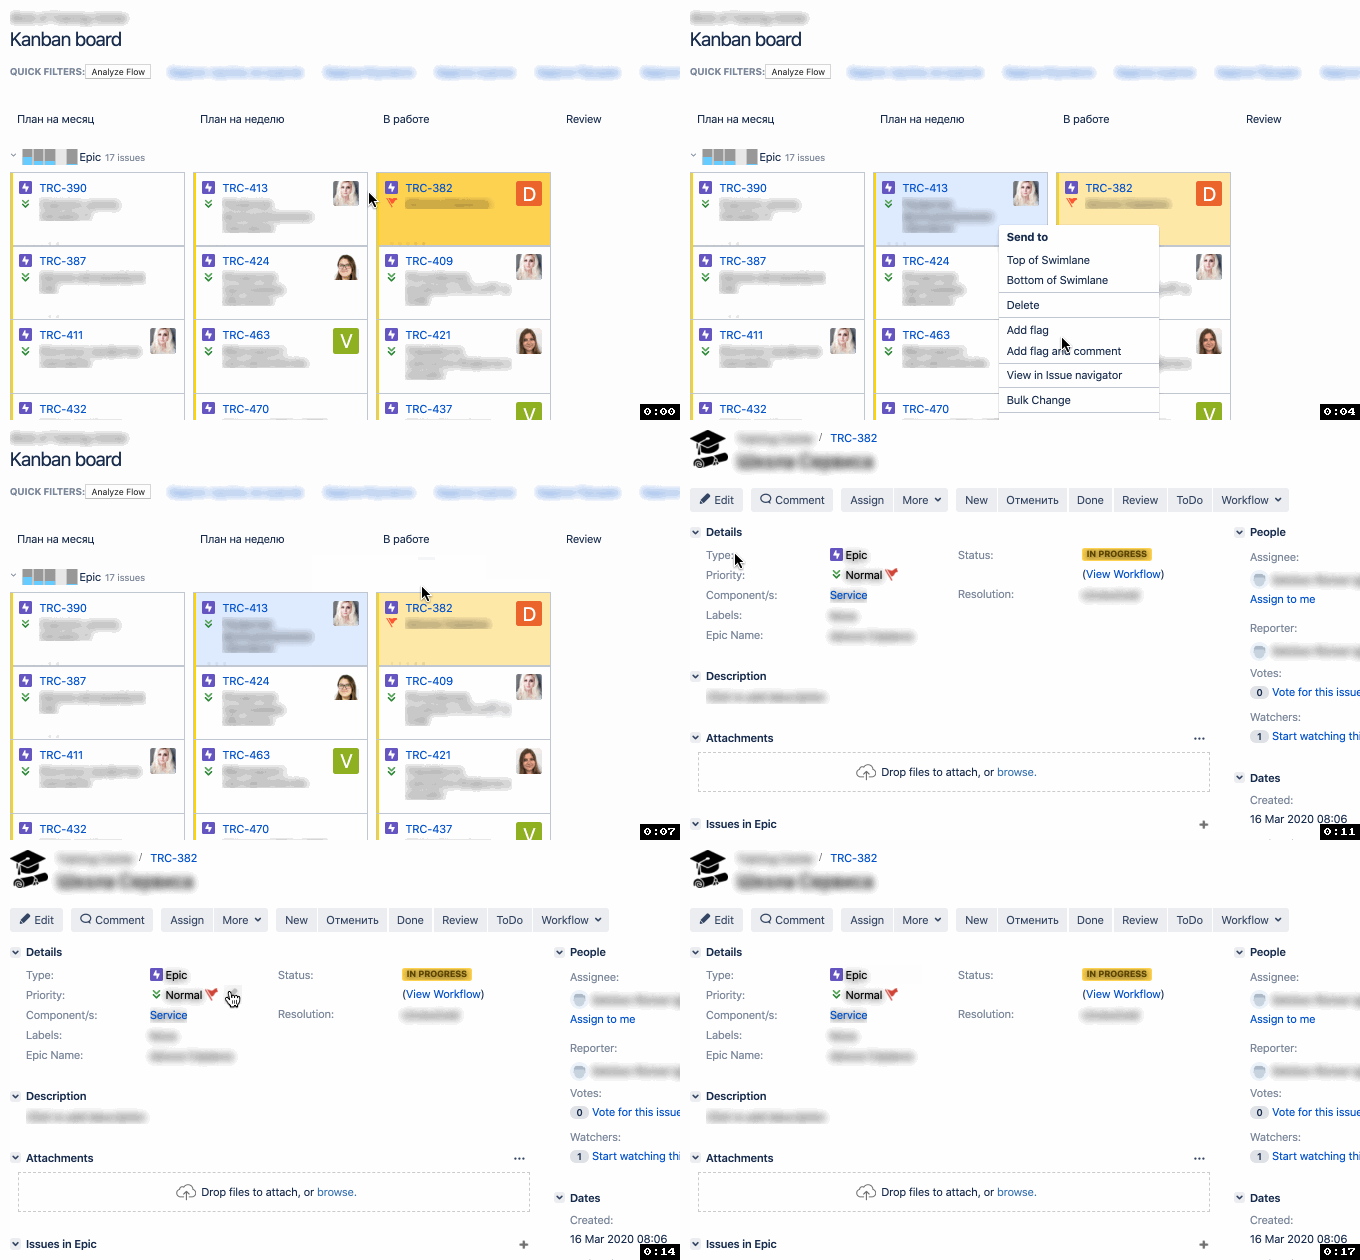
Flag on Issue panel
When in board view, right click on an issue to flag it.
By default, this flag won’t be shown in issue view (jira.server.com/browse/PROJECTID-0001)
Jira-helper extension adds flag display for issue view, right next to priority field.
JIRA Cloud example:

JIRA v7.. example:
Task Description Template
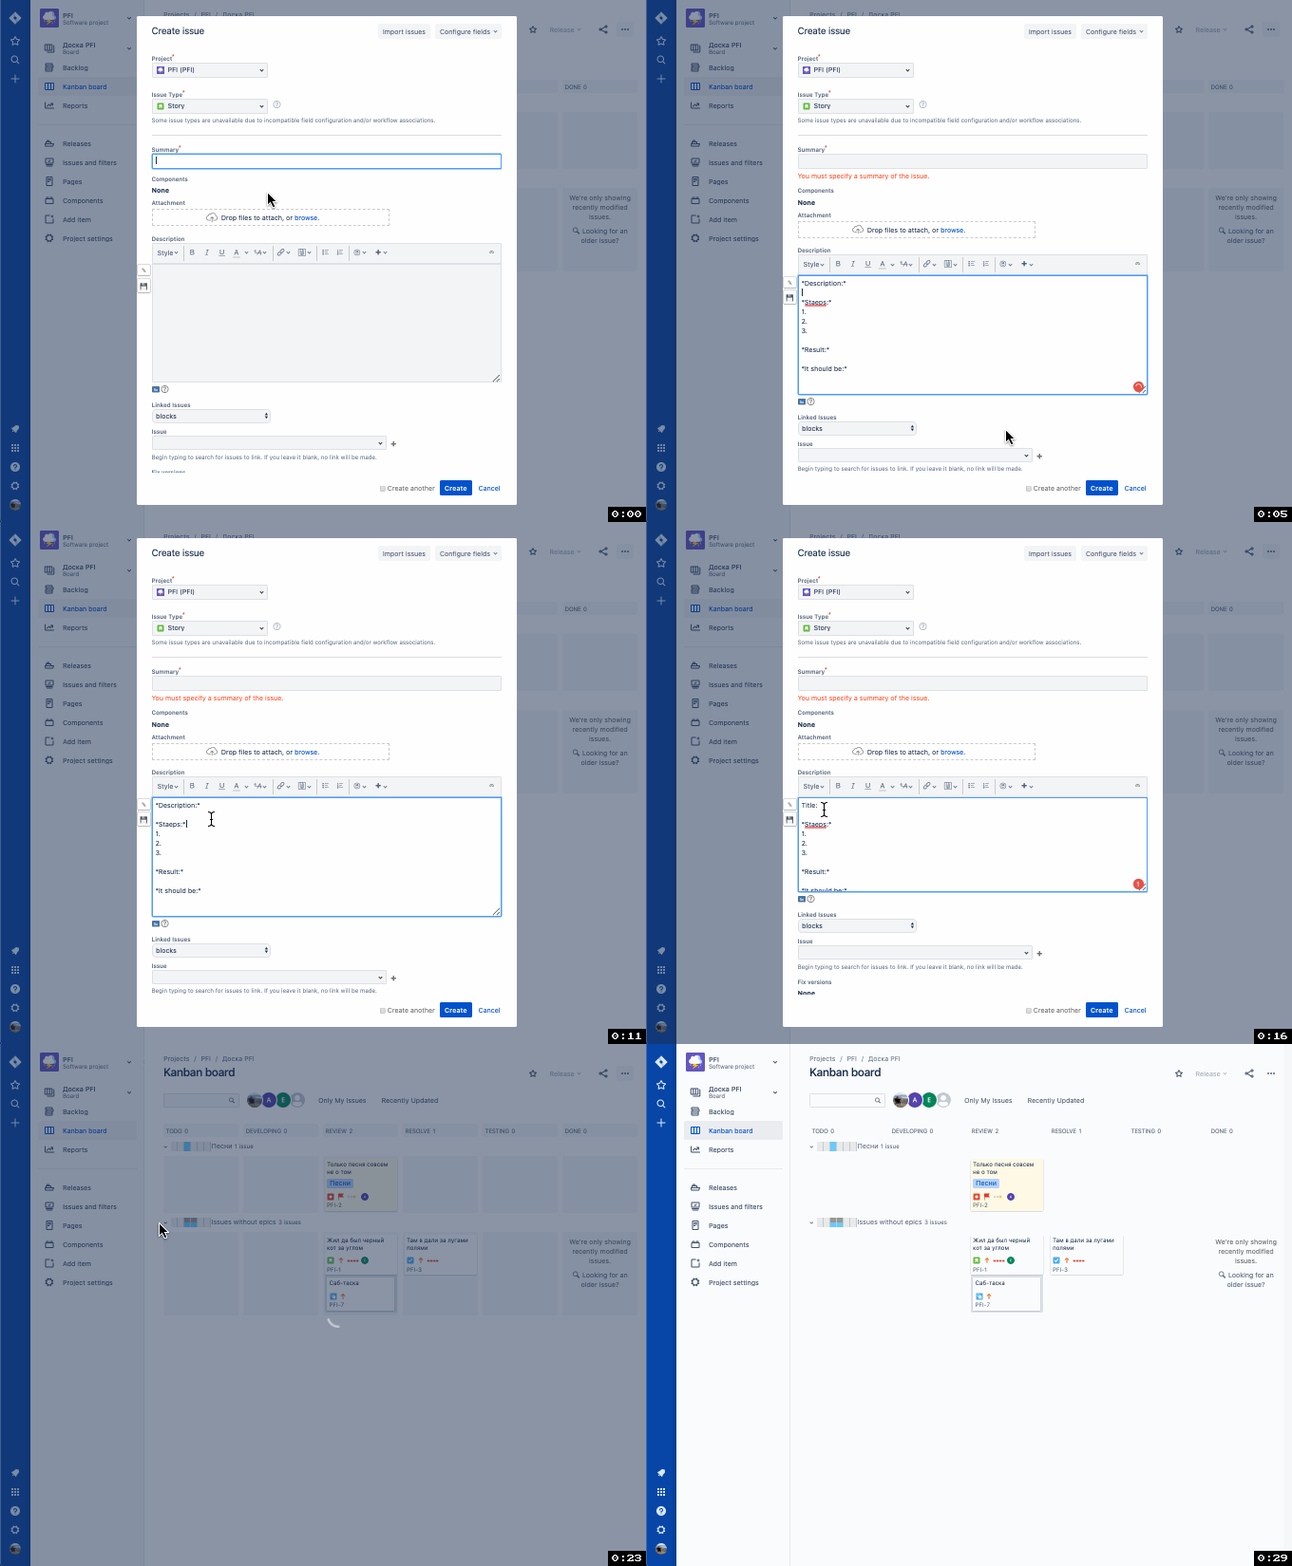
Two buttons are added near the Description field in issue create/edit mode.
Use them to create a Template for this issue type. It’s stored locally in your browser so it isn’t shared with anyone.More about localStorage
Scrum Tetris-planning
Tetris-planning allows you to specify separate size measures for different specialists on your team.
When your team has programmers and testers doing work strictly according to their job titles, maintaining a joint estimation might get tricky.
This happens, because different specialists don’t usually understand each other that well.
Tetris-planning approach can be used to overcome that.
The approach itself was popularised by Max Dorofeev in one of his speeches
However, there are critics of this approach here
When using JIRA Scrum-boards you can add issues to the Sprint backlog.
By default, JIRA only allows you to use one estimation value, i.e. Story Points.
This way, the Sprint header will show three sums: not started issues (gray), in progress issues (blue), done issues (green).

Jira-helper adds a feature to use several values to visualize estimations.
It doesn’t matter, whether they are Story Points or any other integer value.
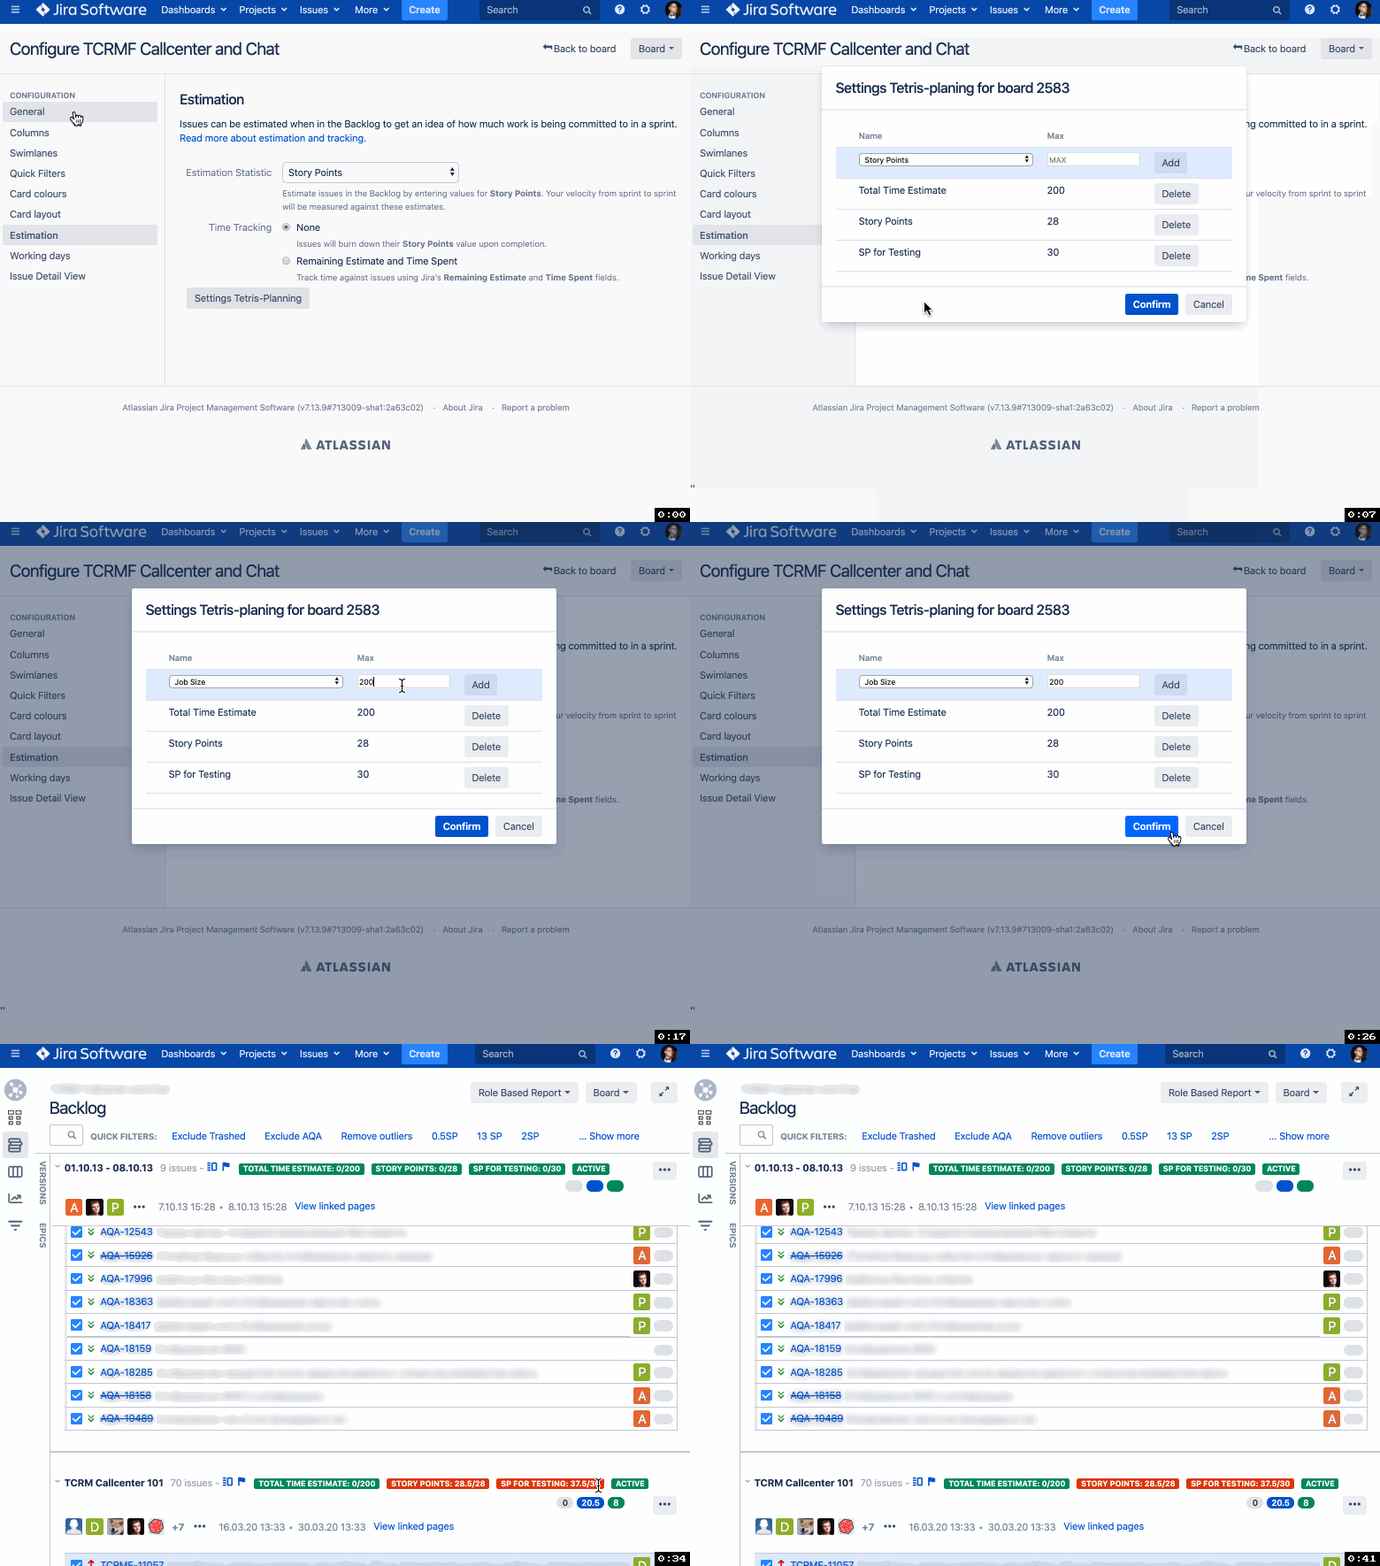
Now, Scrum Sprint backlog headers will display chosen values for the chosen parameters.
They are displayed like this: param name: (sum of this parameter estimations in the sprint)/(max sum of this estimate)
Where:
param nameis the name of the parameter used for estimationsum of this parameter estimations in the sprintis all this Sprint’s estimates by this parameter summed upmax sum of this estimateis the maximum possible value for this parameter for this Sprint
If sum of this estimate in the sprint is greater than max sum of this estimate, the tag will appear red to show that you shouldn’t add more tasks for this estimation parameter.
Otherwise, the tag will appear green.
“Board Settings (Scrum board) -> Estimates” Only the Board Administrator can save this setting.
Printing Multiple Stickers
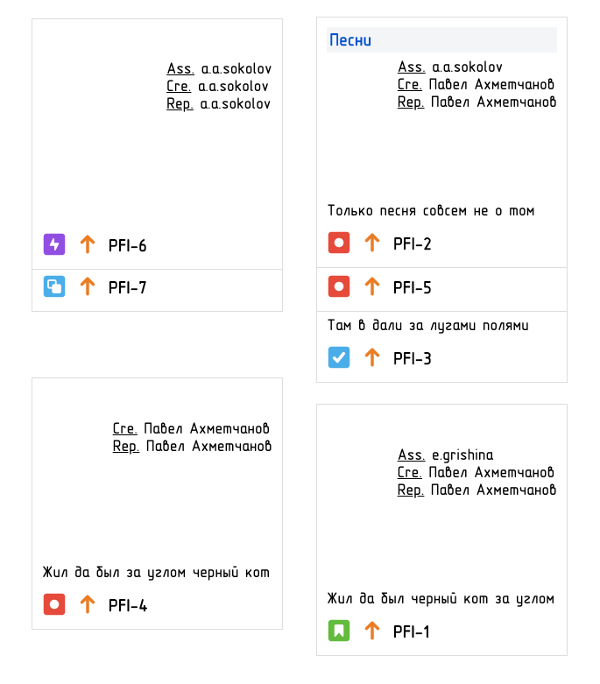
This feature allows you to print lots of stickers using your office printer.
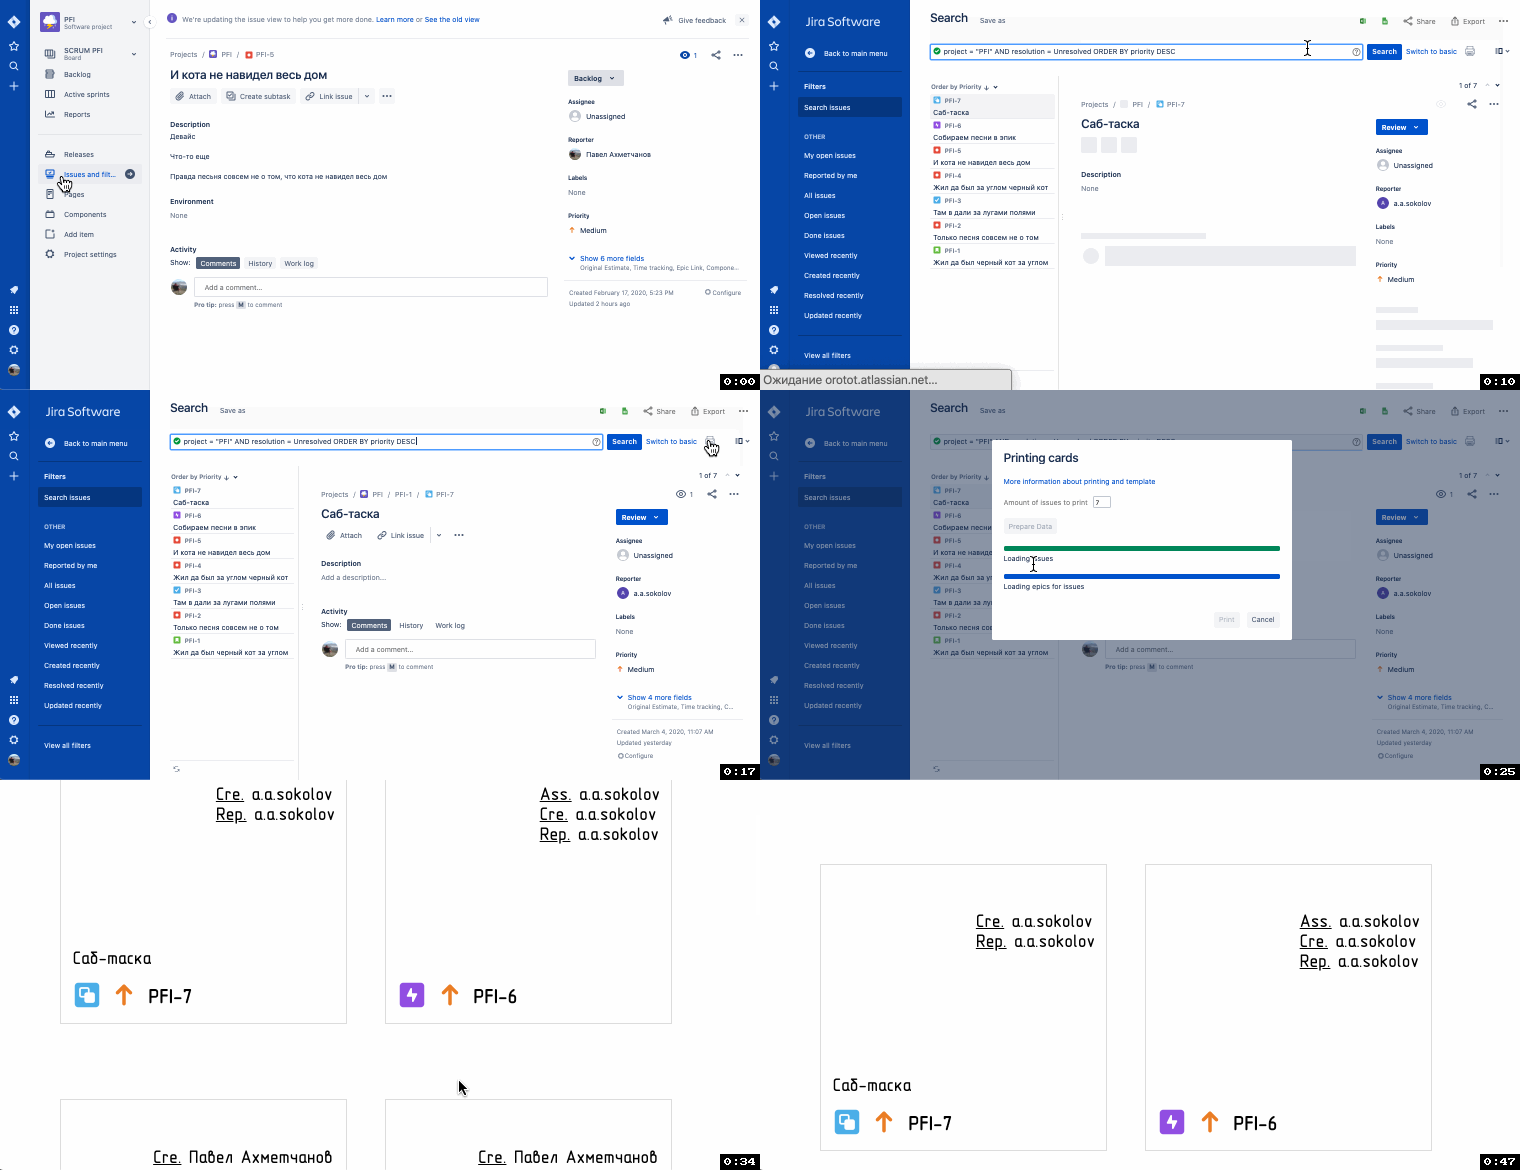
Use the template to print post-its on an ordinary A4 paper sheet.
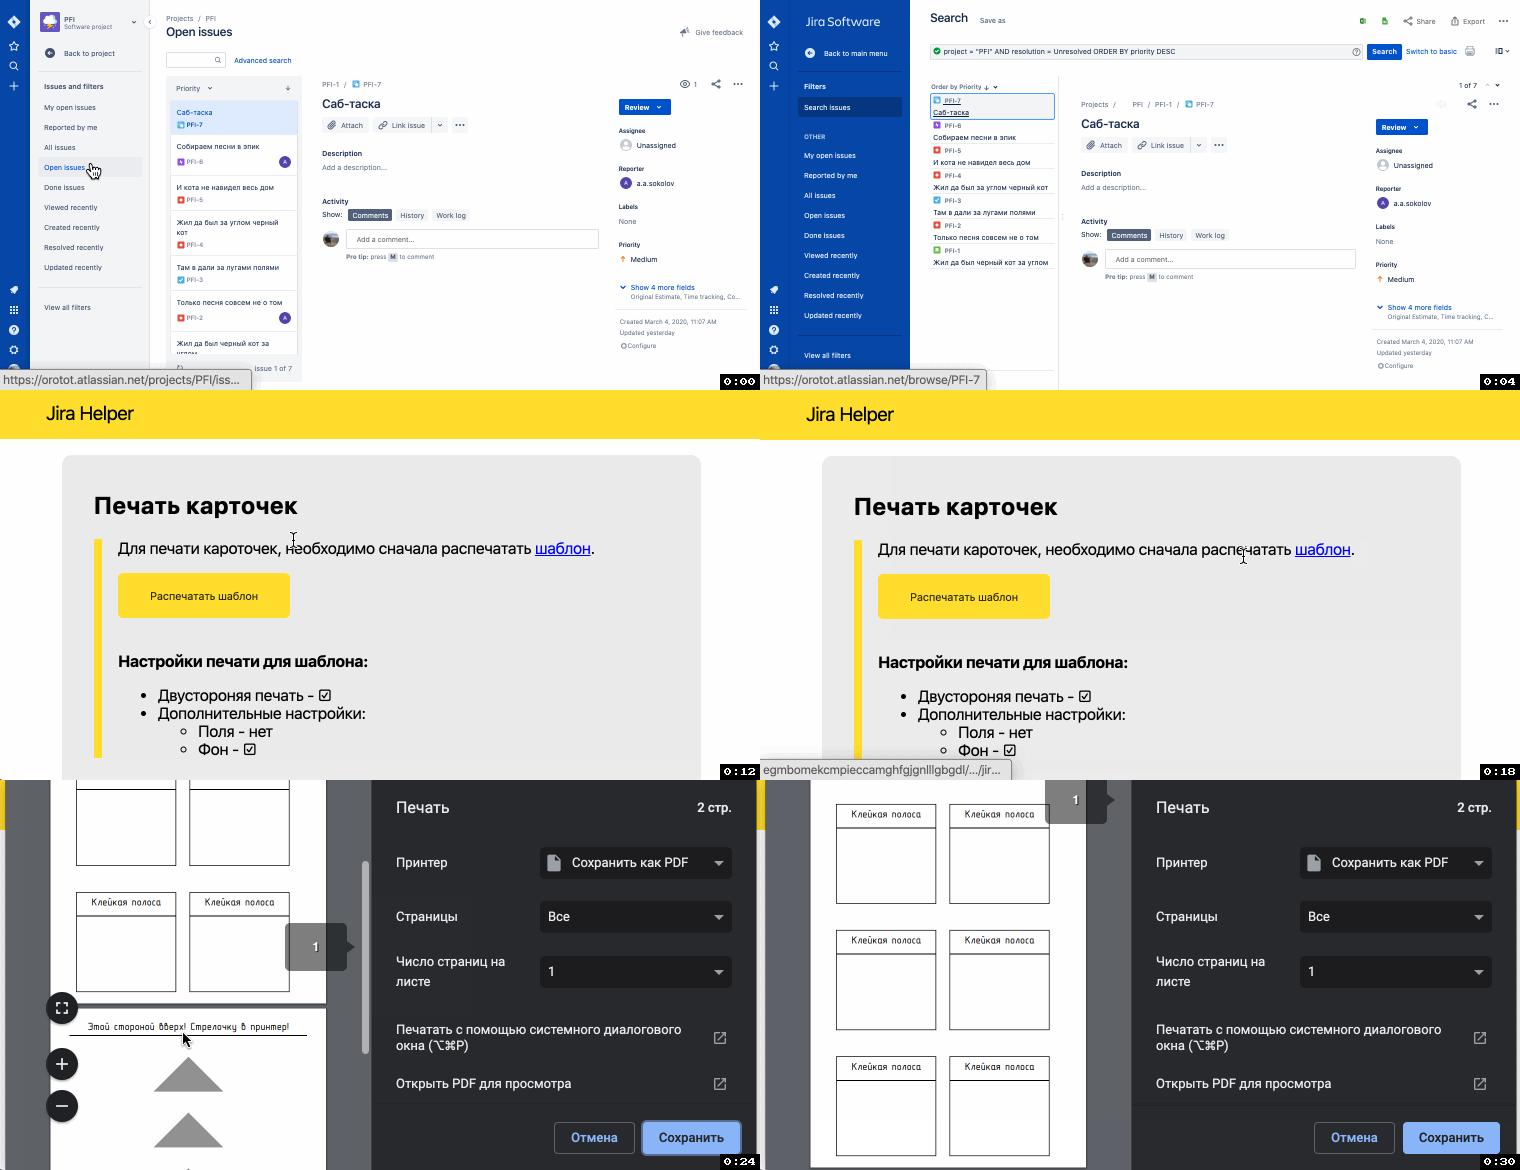
The print template uses
- GOST A and GOST B fonts
- a specific way of displaying the issue number at the bottom of the post-it
- color coding of the associated Epic (in the example below, the Epic name is “Песни”)
This lets you conveniently use the post-its like this
WIP-limits for several columns (CONWIP)
WIP – work in progress
By default, JIRA allows you to set a limit for a column but doesn’t allow you to combine columns under a shared limit.
However, to visualize a Kanban system, we often need combined WIP-limit constraints.
Jira-helper enables you to do this.
Set it up in the board settings by choosing columns which will share the constraint.
“Board Settings -> Columns” Only the Board Administrator can save this setting.
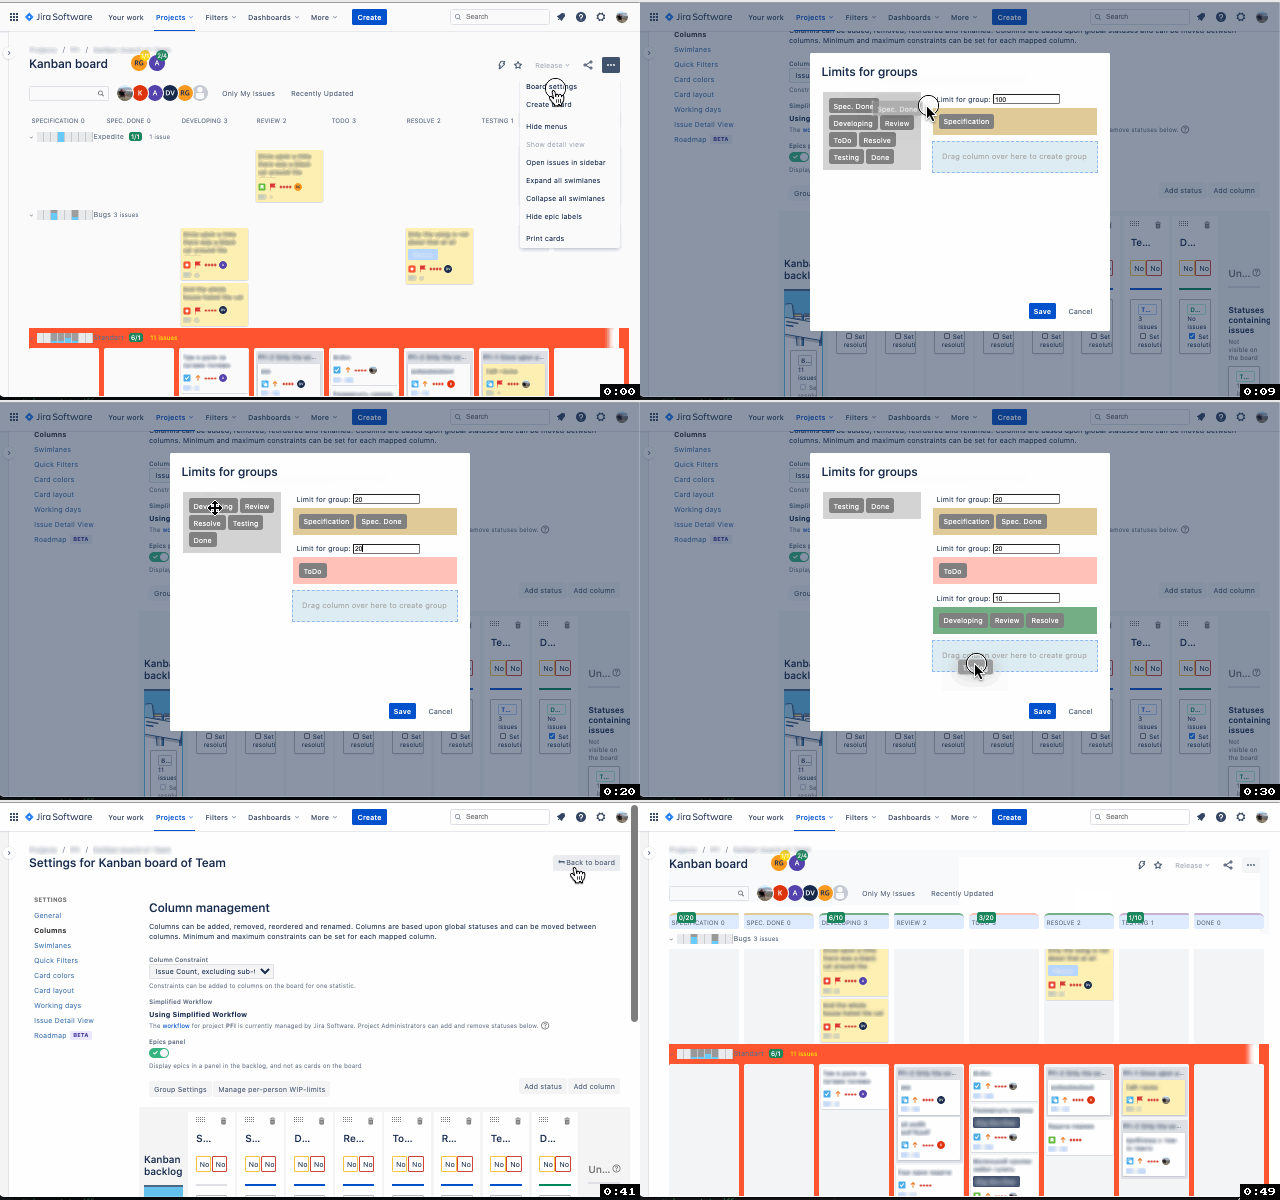
You are still able to use the default JIRA WIP-limits, while using the combined WIP-limits.
Combined constraint will be displayed above the column titles.
If the limit is violated, the column background will turn red.

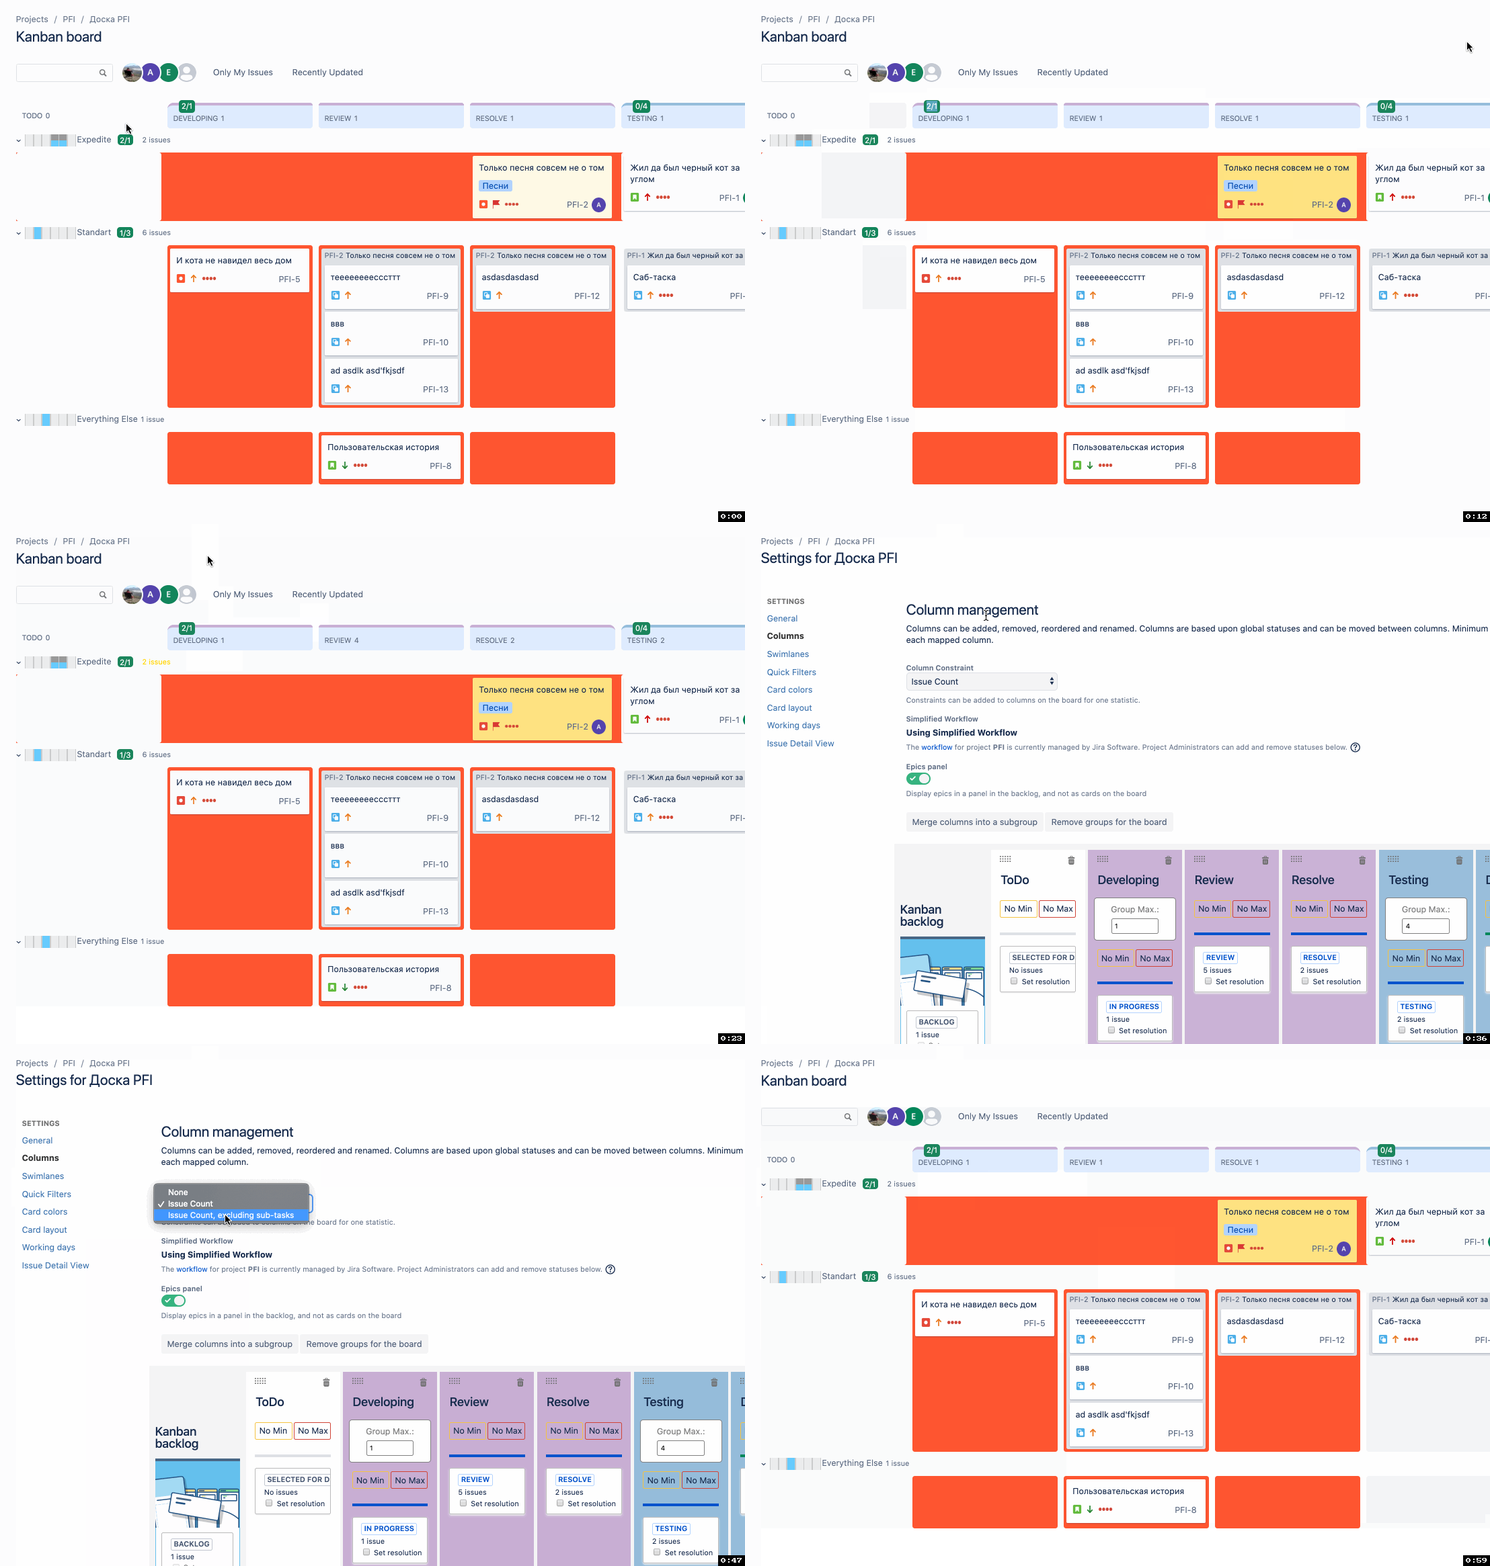
Versions 2.1.0 und above let you choose whether sub-tasks are counted in the combined WIP-limits.
Use the “Column constraint” setting to select if sub-tasks are counted.
WIP-limits for Swimlanes
Kanban-systems may use different types of WIP-limits, including swimlane limits.
There are certain types of swimlanes which are bound only by their own WIP-constraints (i.e. Expedite).
This way, tickets in an expedite swimlane are not accounted for in column WIP.
When setting up WIP-limits using jira-helper, you can specify which swimlanes are not subject to the column constraints.
“Board Settings -> Swimlane” Only the Board Administrator can save this setting

Using a combination of different types of WIP-constraints, you can visualize a very complex delivery system.
WIP-limits for Individual Team Members
Per pesrson WIP-limits are used in proto-Kanban systems.
You can set per person WIP-limits in Column settings of the board.
You can also set specific columns and swimlanes, which will be subject to this person’s WIP-limit.

SLA-line for Control Chart
Control Chart might just be the reason to love JIRA.
”JIRA Control Chart and it’s mysteries” speech (rus. lang) at https://kanbaneurasia.com/
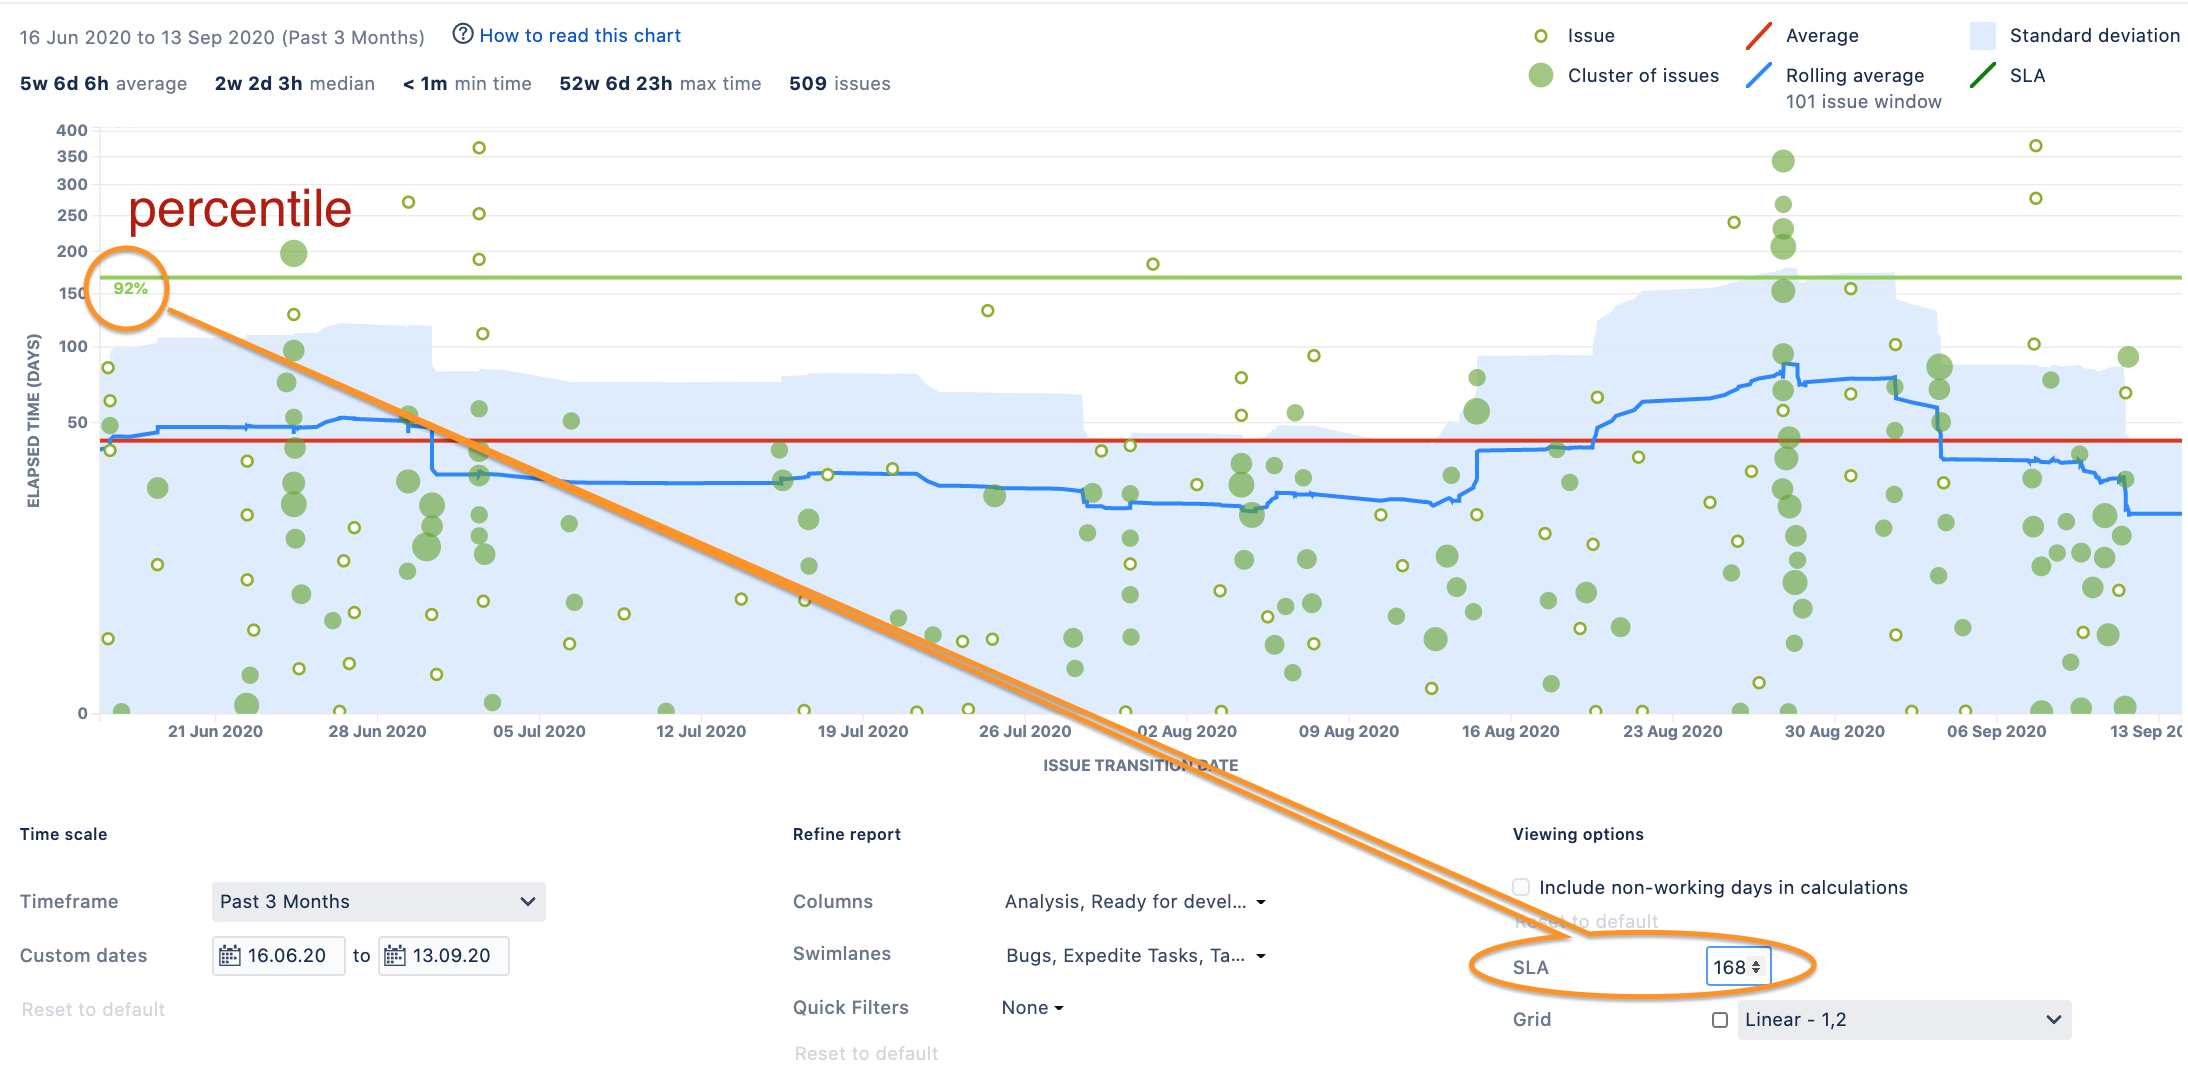
jira-helper introduces a Service Level Agreement (SLA) line to your Control Chart.
This line allows you to specify the desired terms for your team’s Service Level Agreement.
Only the Board Administrator can save this setting.
Use this line without saving to analyze lead times of your system on the fly.
SLA value is displayed in days.
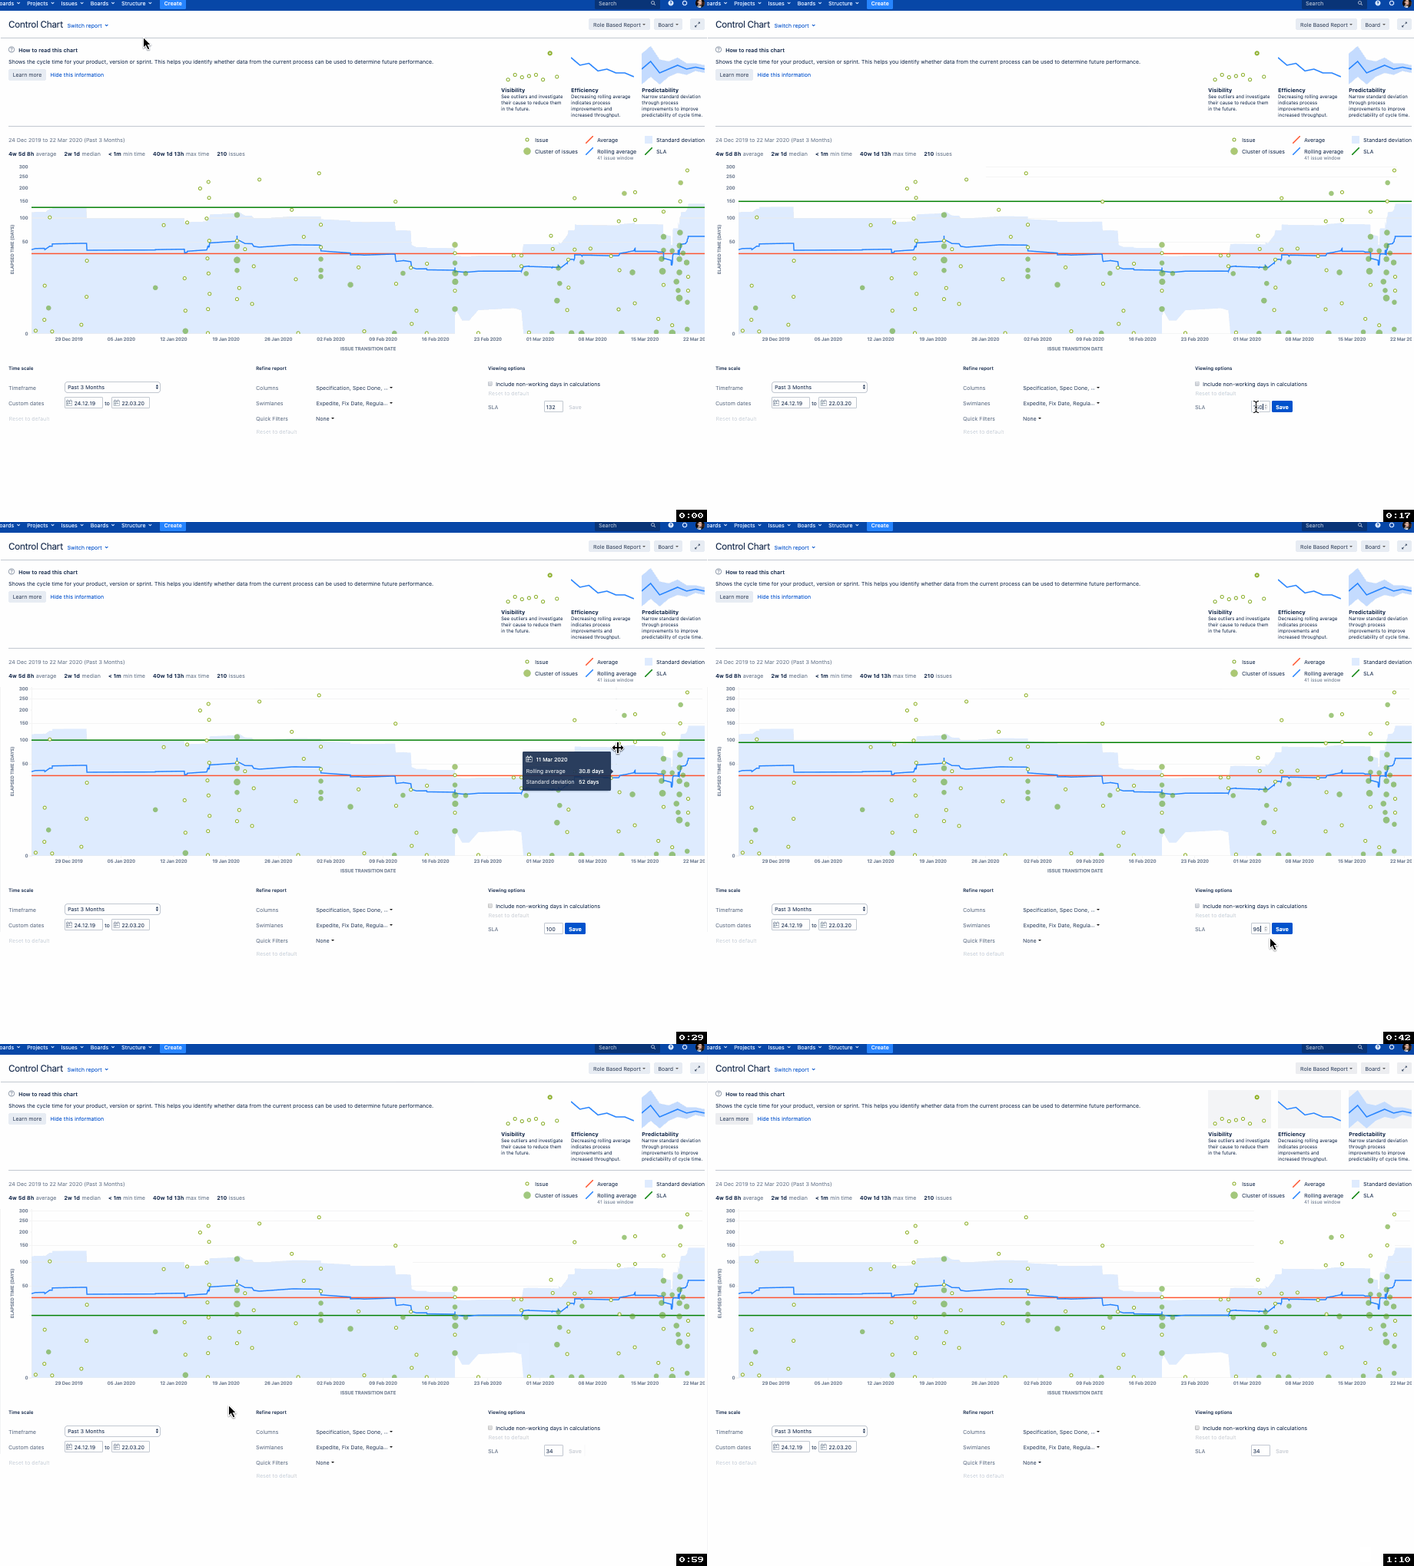
And from version 2.6.0, percentile of issues is displayed near the SLA-line. It is counted by the number of events on the Control Chart.
Control Chart Scale
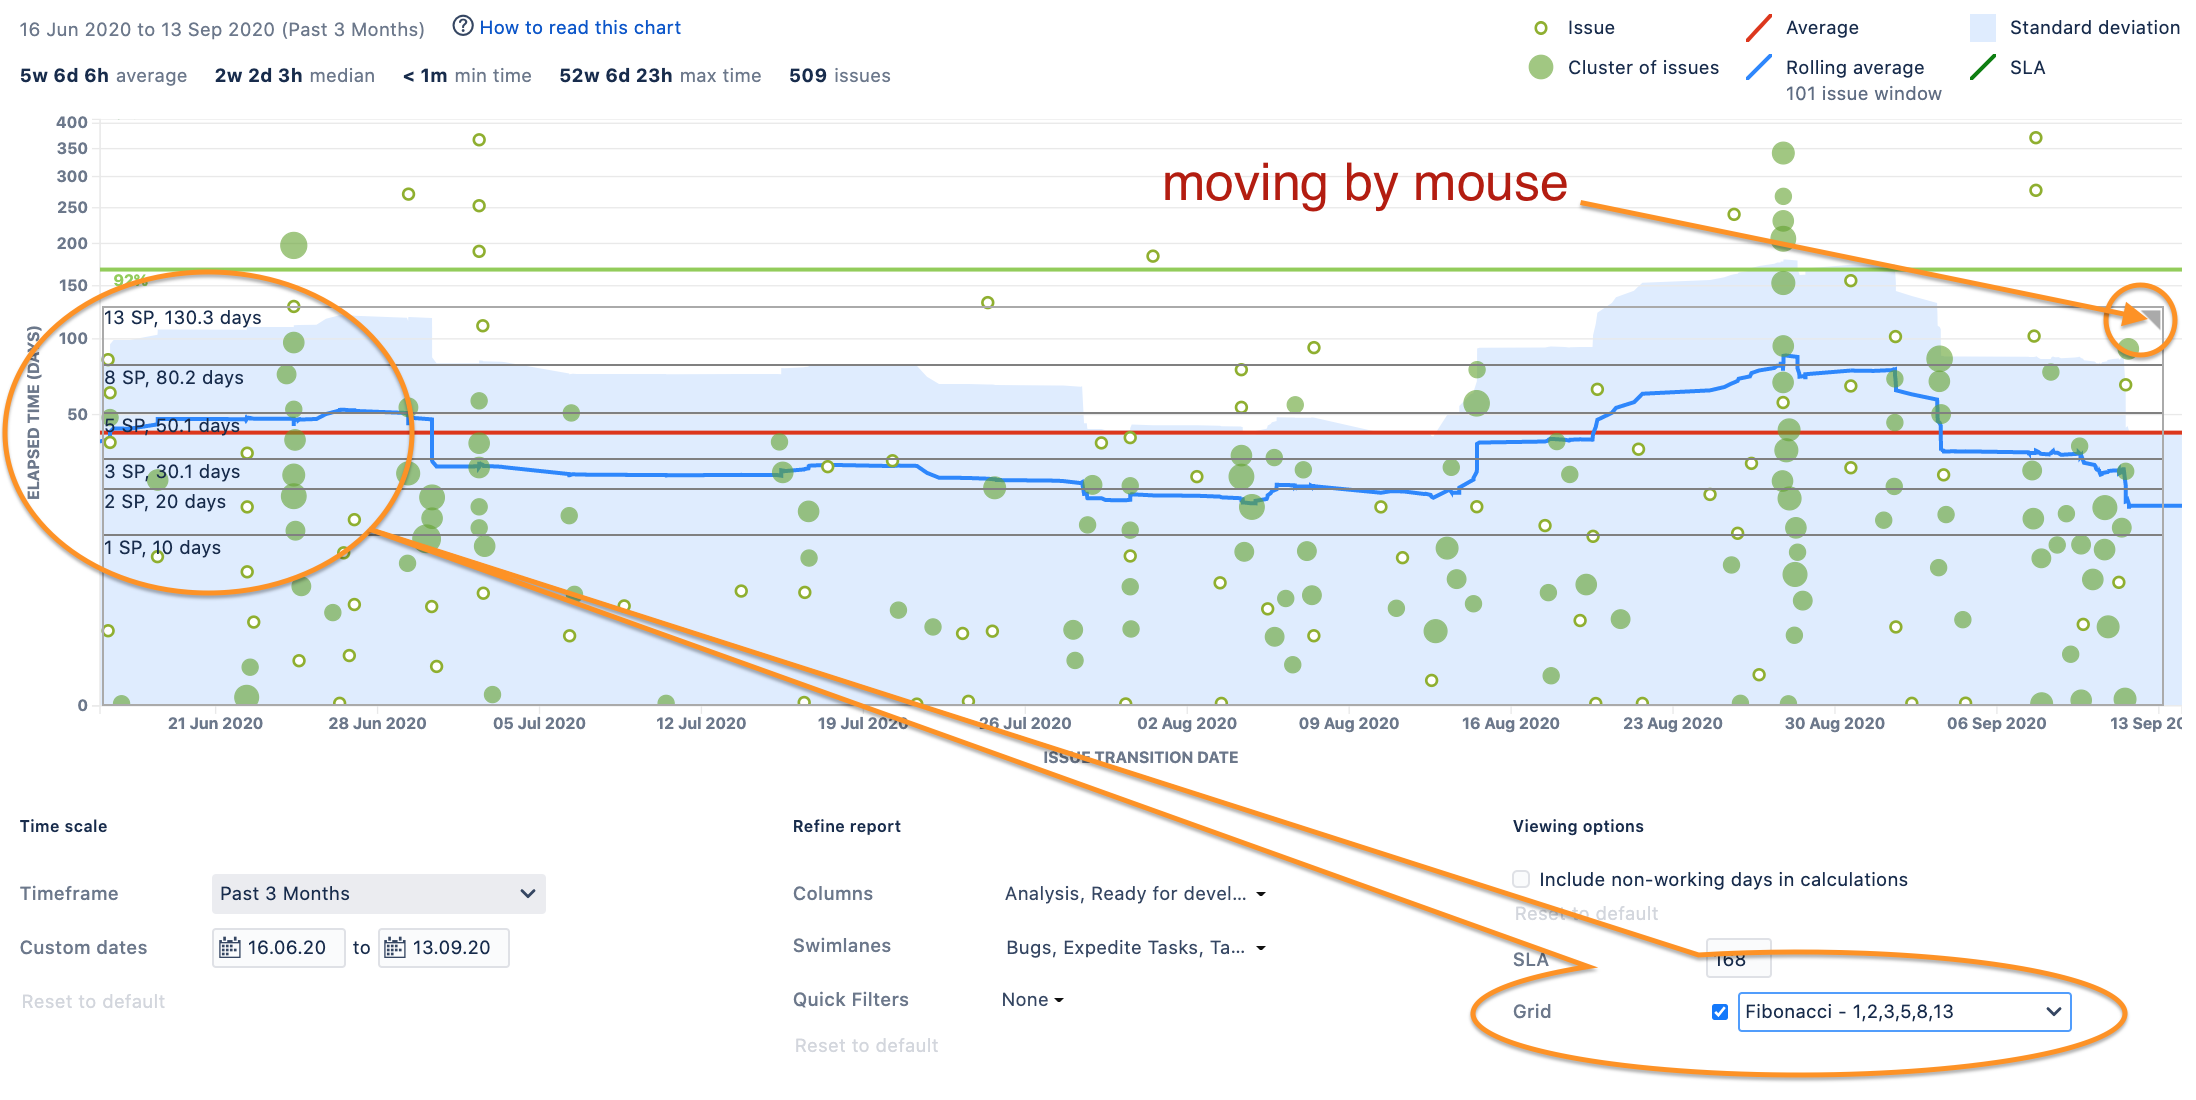
You can analyze issue sizes using the control chart estimations scale. For example, you can check whether you can use different measurement scales (i.e. Fibonacci)
Use the dropdown list near the SLA field to choose the scale you want to check.
The picture shows the Fibonacci scale with a size value of “6”.
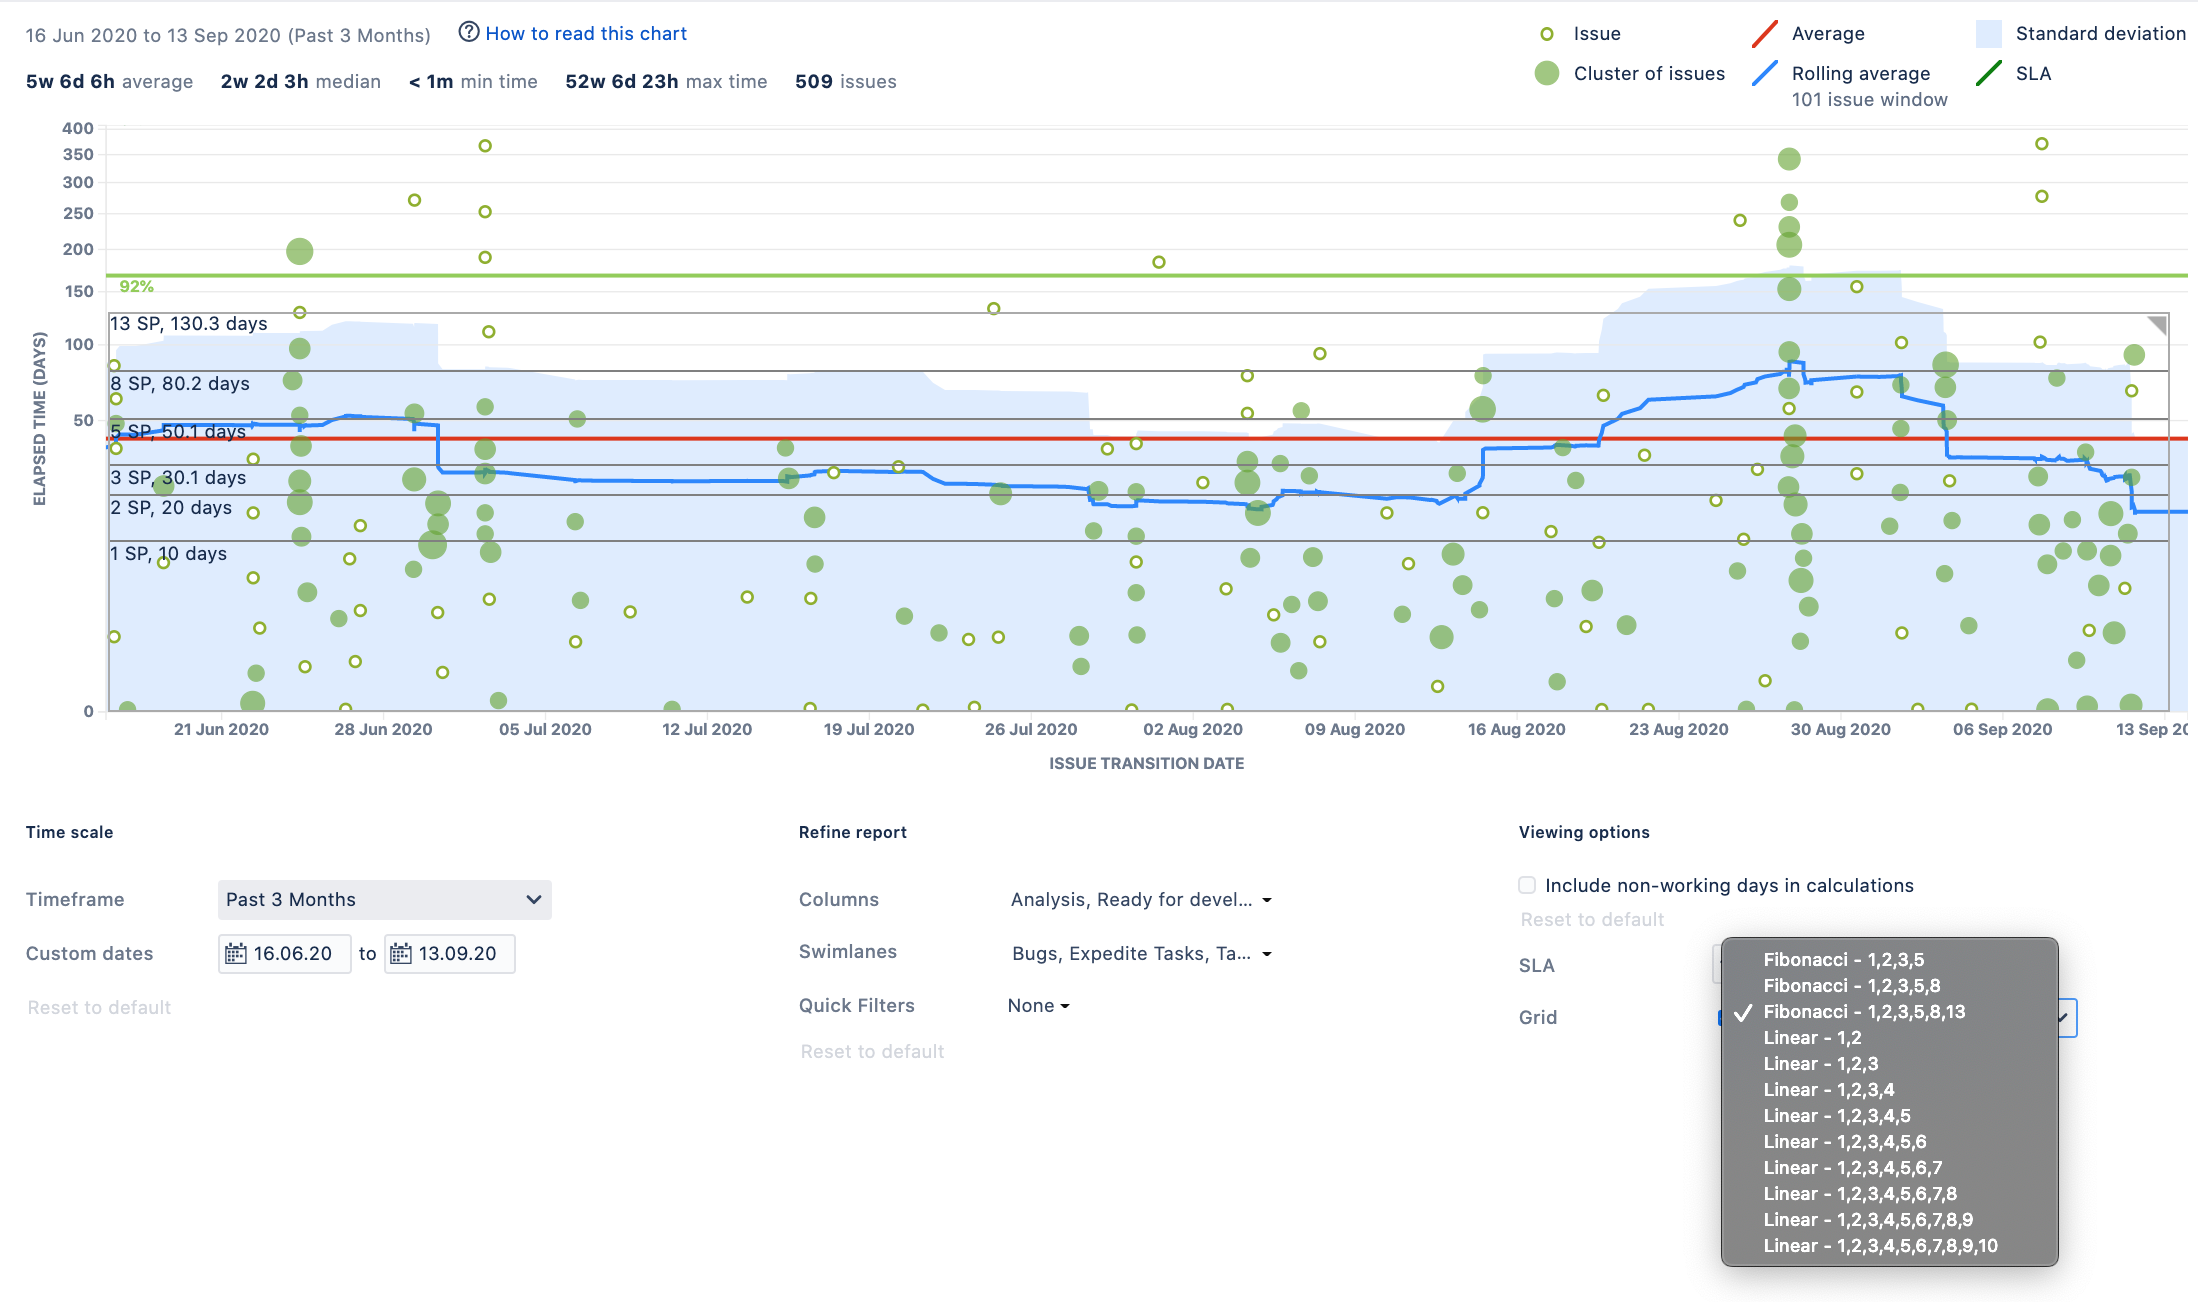
We can see that the leadtimes do not correspond to the chosen scale.
This way we can say that Fibonacci scale doesn’t fit to estimate the work in this system.
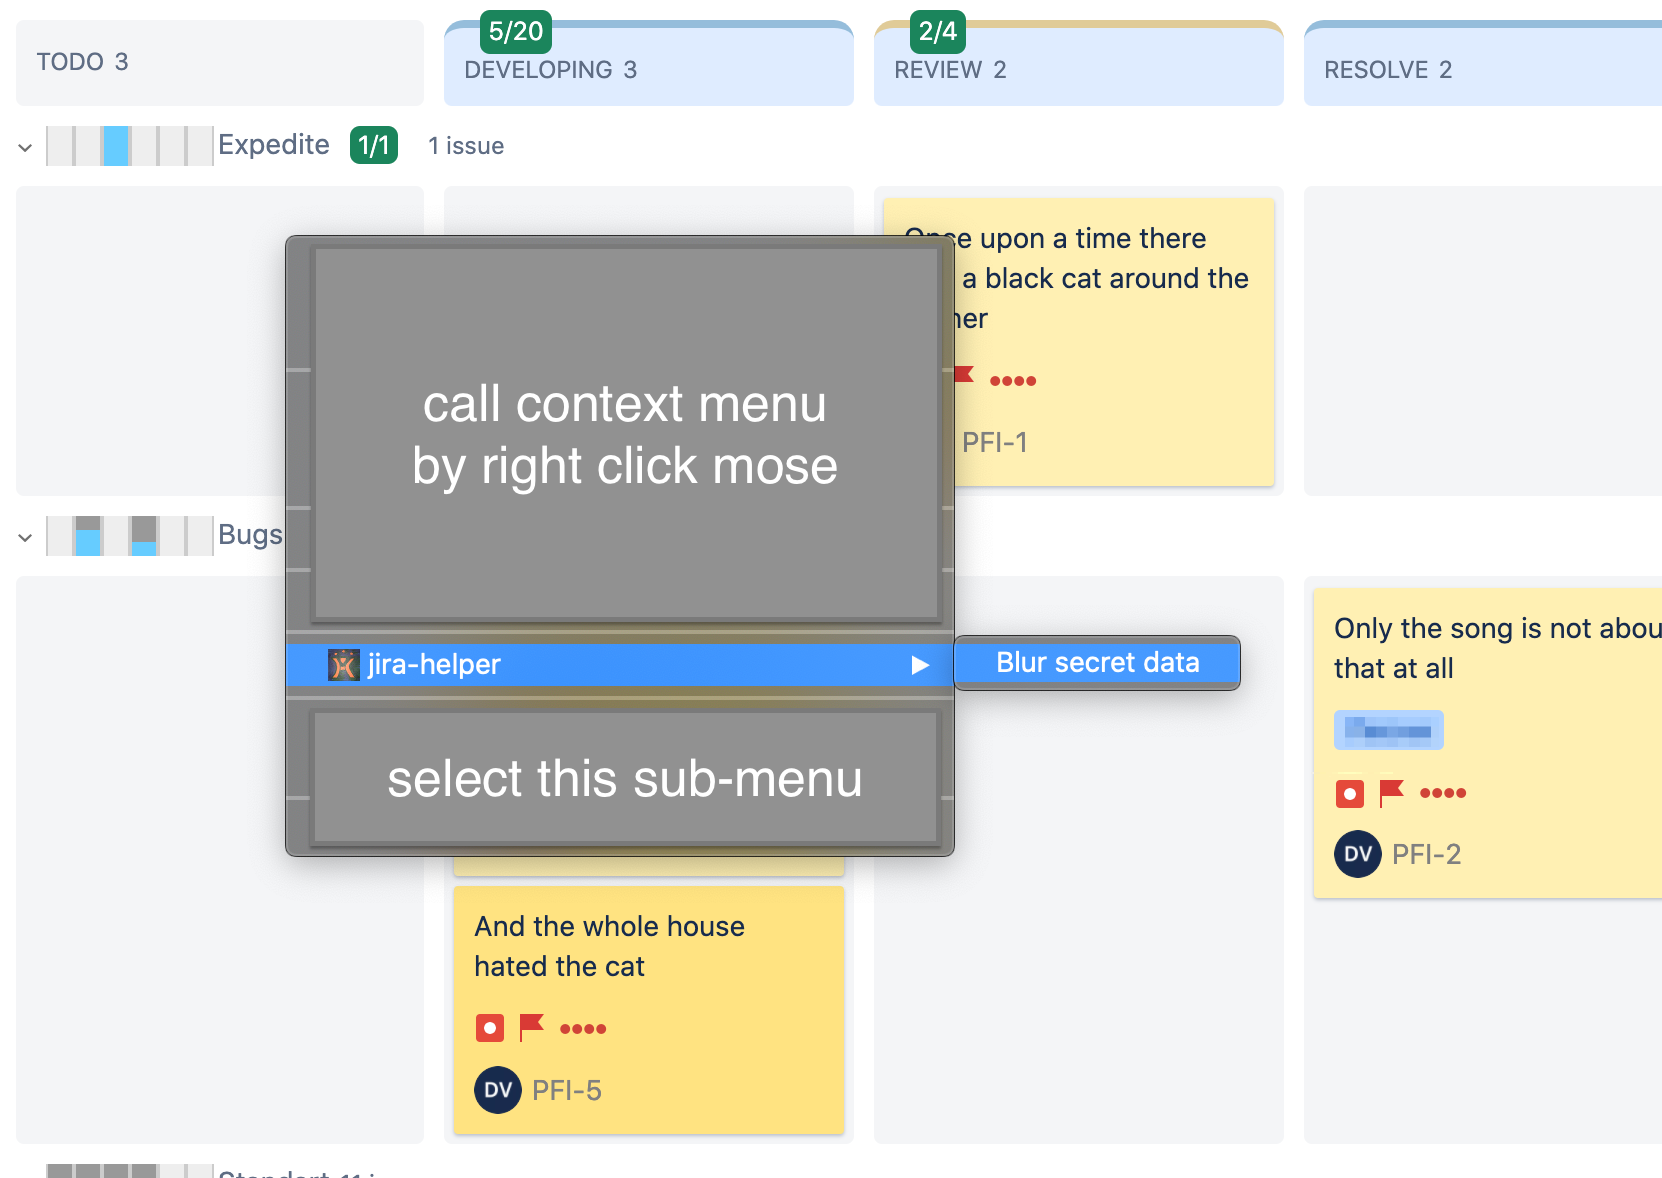
Secret data blurring
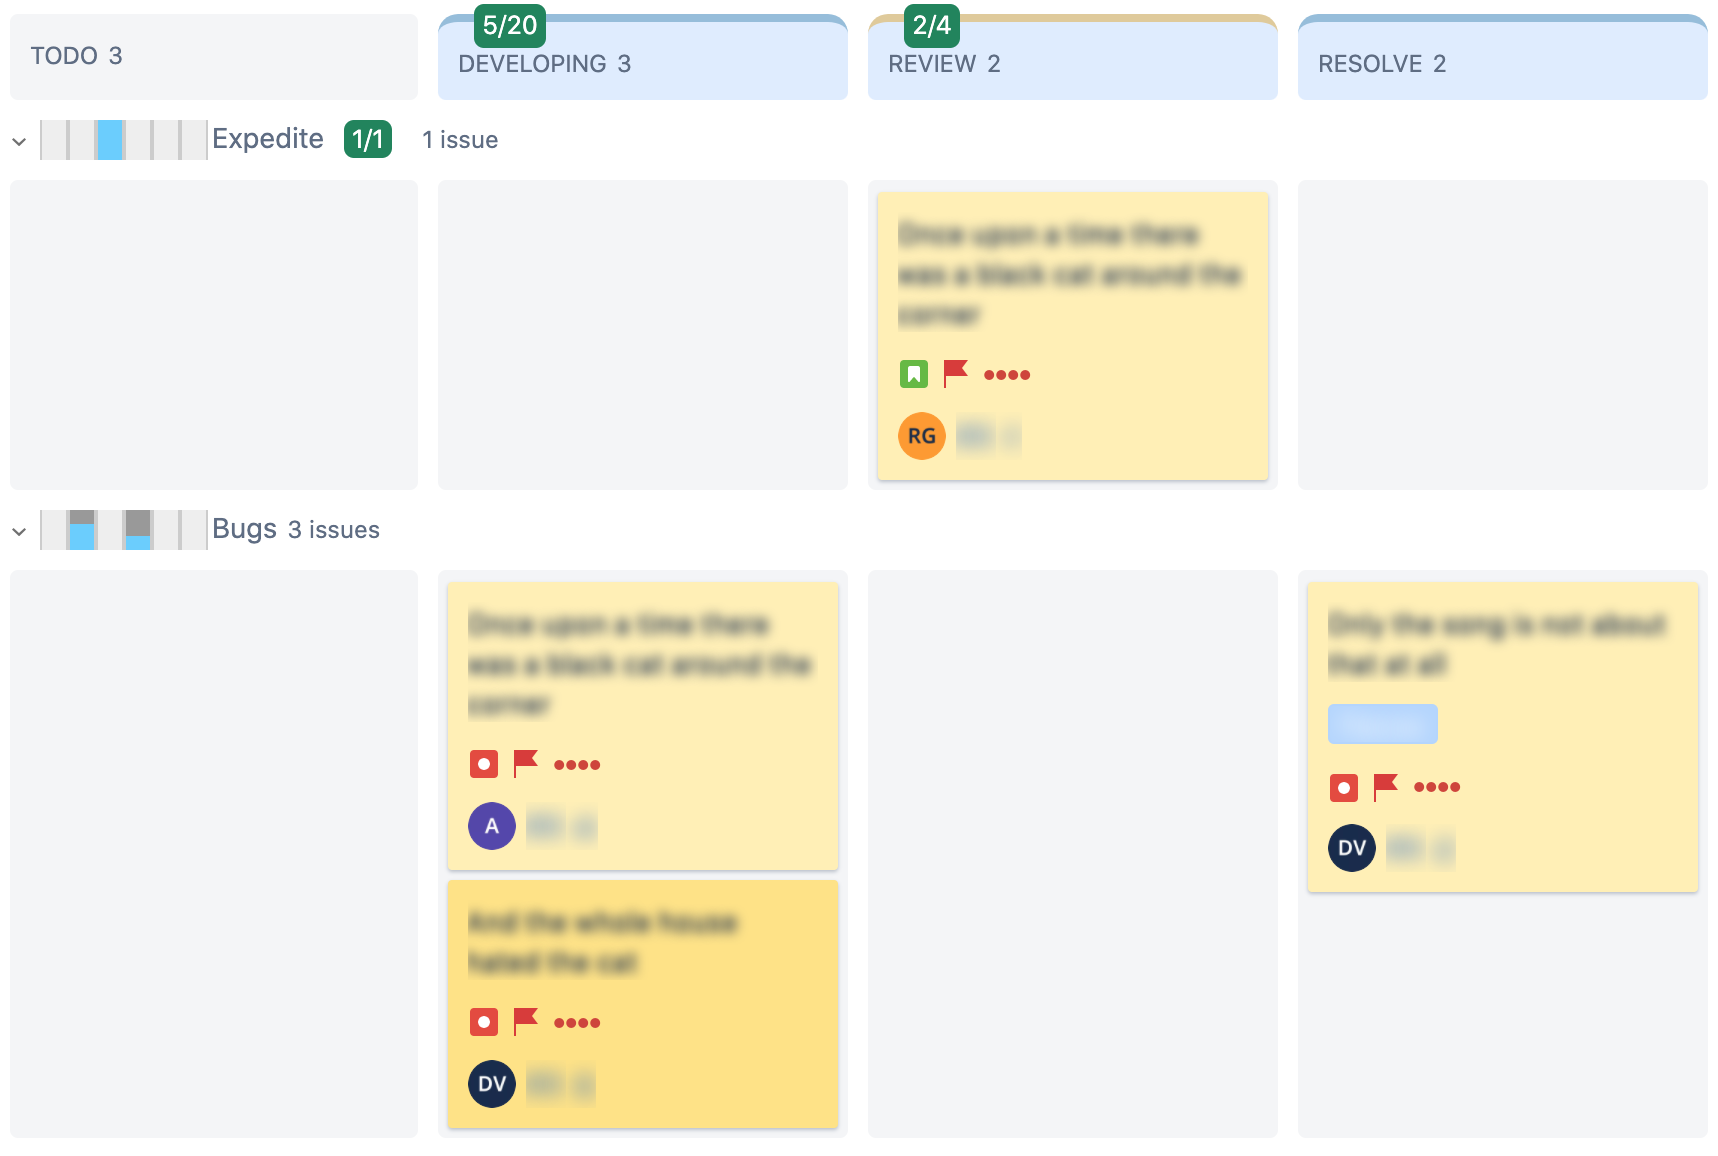
Sometimes you need to hide data about your tasks, still showing your visualization to colleagues. To do this, you can blur this data through the context menu by enabling the “blur secret data” function
Result
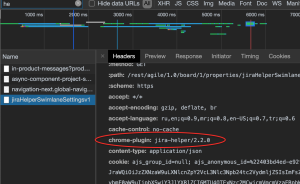
How to identify jira-helper requests
Your JIRA administrators can identify jira-helper requests by the special request header “browser-plugin: jira-helper/{version}”.
